Energy
Visualizing All the Nuclear Waste in the World
Subscribe to the Decarbonization Channel’s free mailing list for more like this.
![]()
Visualizing All the Nuclear Waste in the World
Originally posted on the Decarbonization Channel. Subscribe to the free mailing list to be the first to receive decarbonization-related visualizations, with a focus on the U.S. power sector.
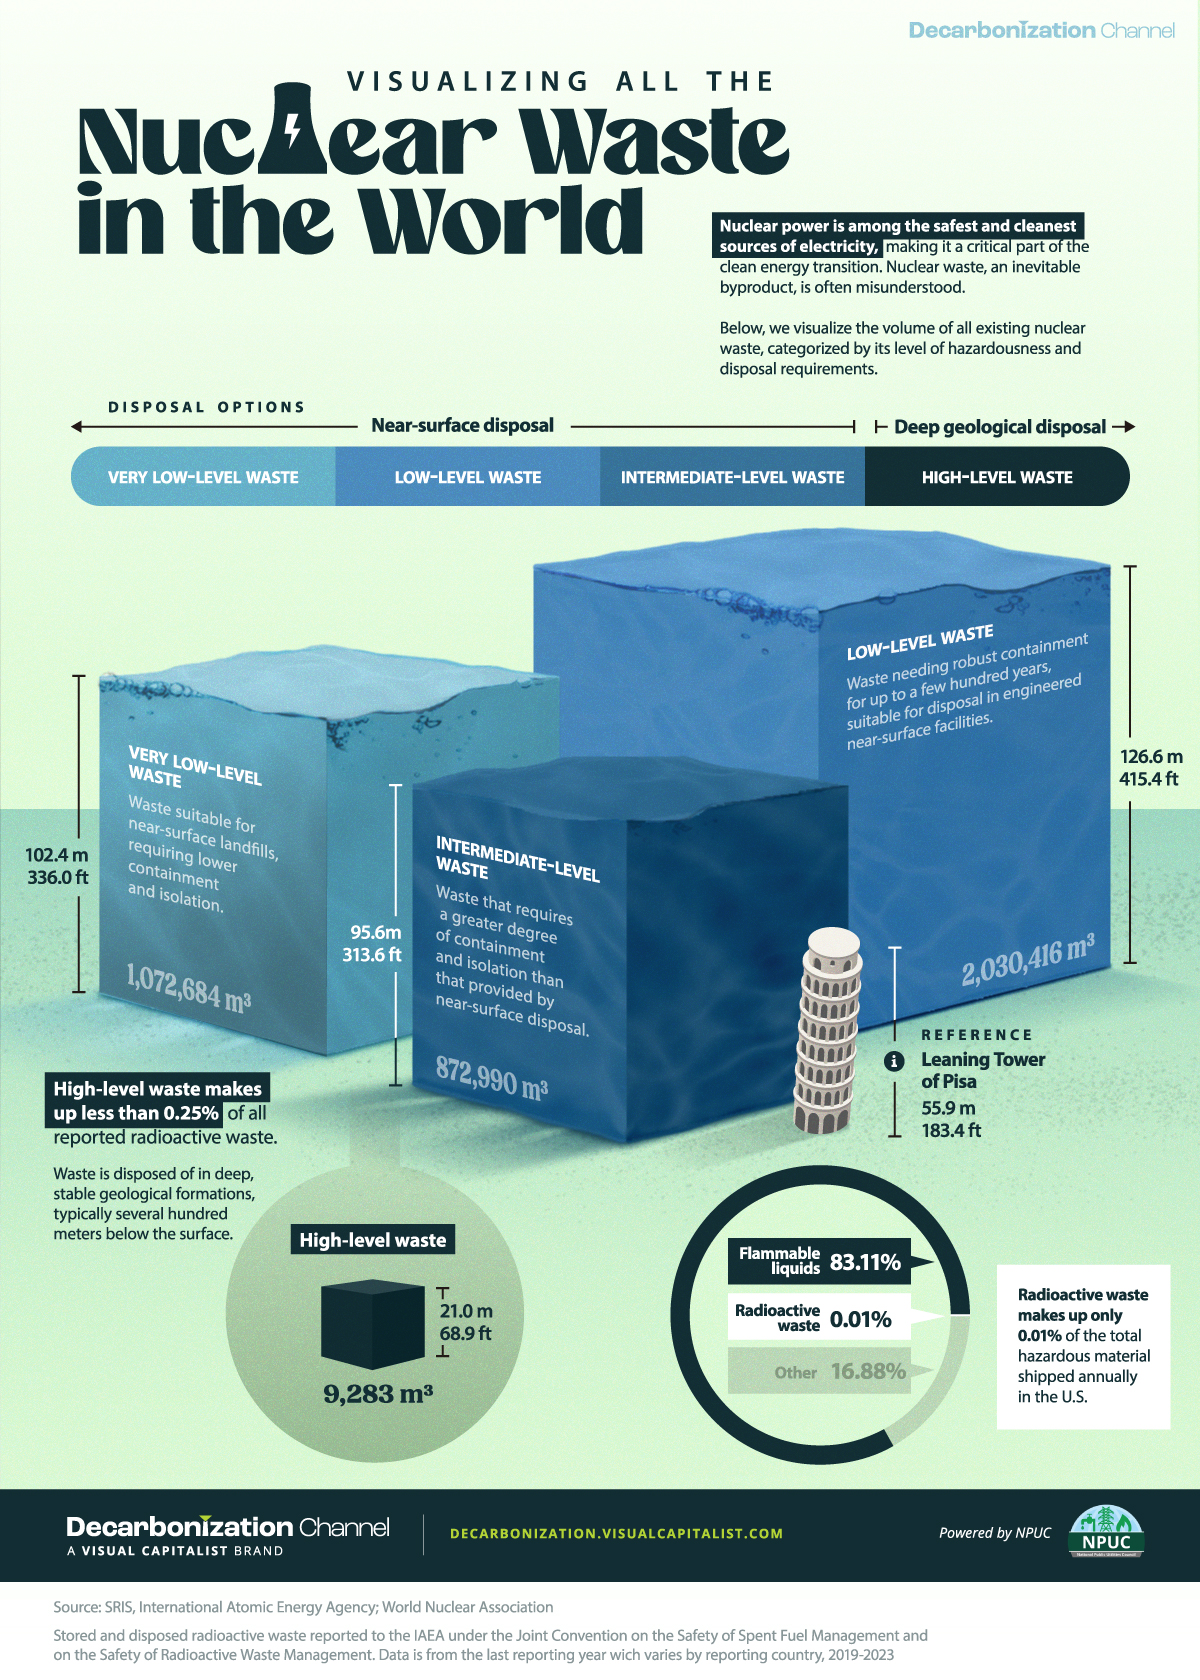
Nuclear power is among the safest and cleanest sources of electricity, making it a critical part of the clean energy transition.
However, nuclear waste, an inevitable byproduct, is often misunderstood.
In collaboration with the National Public Utilities Council, this graphic shows the volume of all existing nuclear waste, categorized by its level of hazardousness and disposal requirements, based on data from the International Atomic Energy Agency (IAEA)..
Storage and Disposal
Nuclear provides about 10% of global electricity generation.
Nuclear waste, produced as a result of this, can be divided into four different types:
- Very low-level waste: Waste suitable for near-surface landfills, requiring lower containment and isolation.
- Low-level waste: Waste needing robust containment for up to a few hundred years, suitable for disposal in engineered near-surface facilities.
- Intermediate-level waste: Waste that requires a greater degree of containment and isolation than that provided by near-surface disposal.
- High-level waste: Waste is disposed of in deep, stable geological formations, typically several hundred meters below the surface.
Despite safety concerns, high-level radioactive waste constitutes less than 0.25% of total radioactive waste reported to the IAEA.
| Waste Class | Disposed (cubic meters) | Stored (cubic meters) | Total (cubic meters) |
|---|---|---|---|
| Very low-level waste | 758,802 | 313,882 | 1,072,684 |
| Low-level waste | 1,825,558 | 204,859 | 2,030,416 |
| Intermediate level waste | 671,097 | 201,893 | 872,990 |
| High-level waste | 3,960 | 5,323 | 9,283 |
Stored and disposed radioactive waste reported to the IAEA under the Joint Convention on the Safety of Spent Fuel Management and on the Safety of Radioactive Waste Management. Data is from the last reporting year which varies by reporting country, 2019-2023.
The amount of waste produced by the nuclear power industry is small compared to other industrial activities.
While flammable liquids comprise 82% of the hazardous materials shipped annually in the U.S., radioactive waste accounts for only 0.01%.


Stocks
Comparing Saudi Aramco’s $1.9T Valuation to Its Rivals
See how much larger Saudi Aramco’s market cap is compared to rivals like Chevron, ExxonMobil, and Shell.
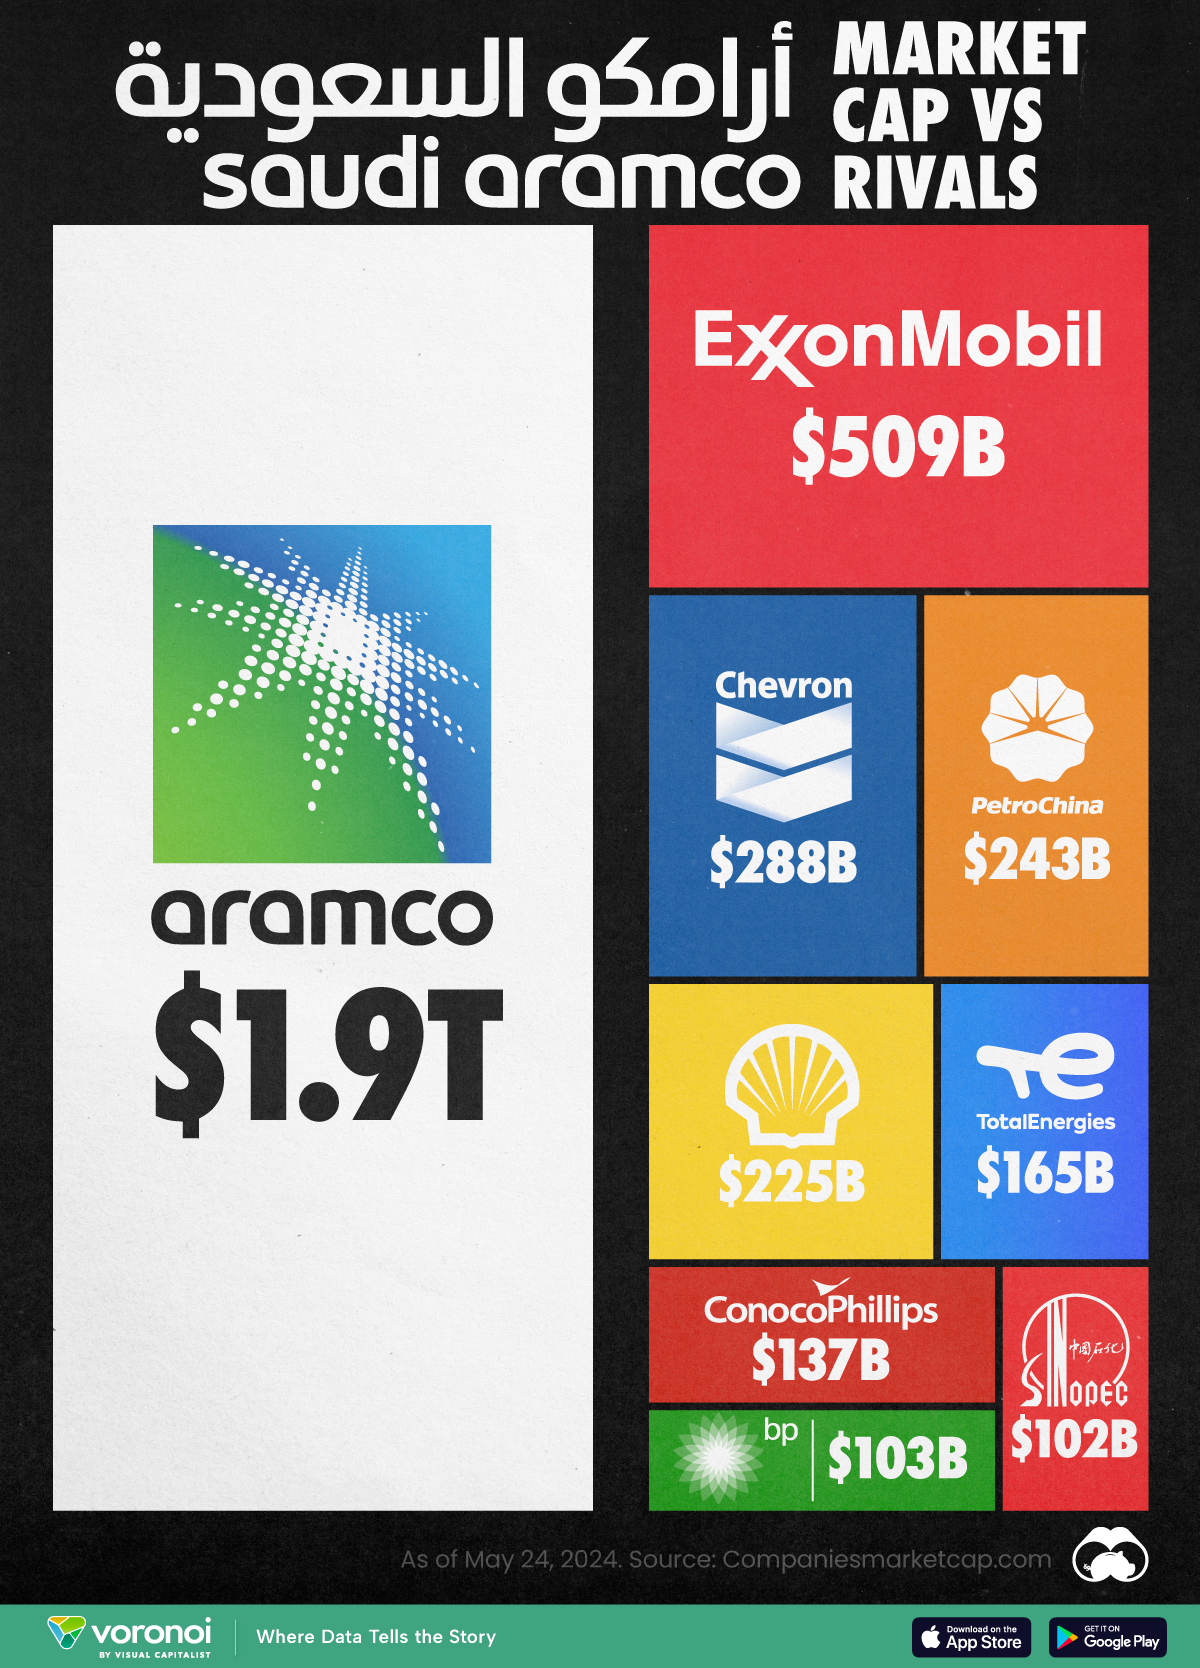

Putting Saudi Aramco’s Market Cap Into Perspective
This was originally posted on our Voronoi app. Download the app for free on iOS or Android and discover incredible data-driven charts from a variety of trusted sources.
As of May 2024, there are just six trillion-dollar companies in the world, and only one of them is an oil company.
In this graphic, we put Saudi Aramco’s market cap into perspective by comparing it to the rest of the world’s largest oil companies. Numbers were sourced from Companiesmarketcap.com, and are as of May 24, 2024.
Data and Takeaways
The data we used to create this graphic are listed in the table below.
| Company | Market Cap (as of May 24, 2024) |
|---|---|
| 🇸🇦 Saudi Aramco | $1,914B |
| 🇺🇸 Exxon Mobil | $509B |
| 🇺🇸 Chevron | $288B |
| 🇨🇳 Petro China | $243B |
| 🇳🇱 Shell | $225B |
| 🇫🇷 TotalEnergies | $165B |
| 🇺🇸 ConocoPhillips | $137B |
| 🇬🇧 BP | $103B |
| 🇨🇳 Sinopec | $102B |
Saudi Aramco launched its initial public offering (IPO) on December 11, 2019. It remains the largest IPO in history, raising $25.6 billion and valuing the company at $1.7 trillion. Aramco is also the only trillion-dollar company that isn’t based in the United States.
As of 2022, Aramco had proven reserves equal to 259 billion barrels of oil equivalent, which is massively greater than rivals like ExxonMobil (17.7 billion) and Chevron (11.2 billion).
$1.9T*
It should be noted that the Saudi government directly owns 90% of the company, while another 8% is held by the country’s sovereign wealth fund. With only 2% of shares available to the public, some believe that the company’s current valuation carries little weight.
For example, a Bloomberg op-ed from 2023 described Aramco’s valuation as an “illusion” due to its very low trading volume. Over a one year period, Aramco’s average daily turnover was just $51 million, compared to $1.9 billion for ExxonMobil and $1.4 billion for Chevron.
See More Market Cap Comparisons from Visual Capitalist
If you enjoyed this graphic, be sure to check out our similar graphic covering Nvidia.
-
 population6 days ago
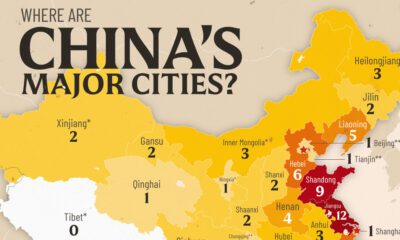
Mapped: Chinese Provinces With Cities Over 1 Million People
-
 Maps2 weeks ago
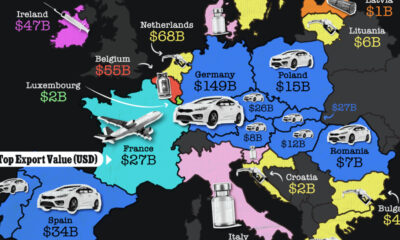
Mapped: The Top Export in Each EU Country
-

 population2 weeks ago
Mapped: Indian States with Cities Over 1 Million People
-
 Technology2 weeks ago
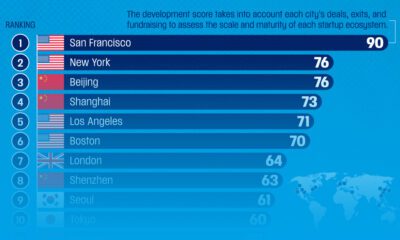
Ranked: The Top Startup Cities Around the World
-
 Markets2 weeks ago
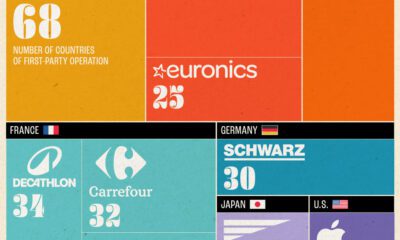
Which Retailers Operate in the Most Countries?
-

 Personal Finance2 weeks ago
Mapped: The Income a Family Needs to Live Comfortably in Every U.S. State
-

 Energy2 weeks ago
Ranked: The World’s Largest Lithium Producers in 2023
-
 Maps2 weeks ago
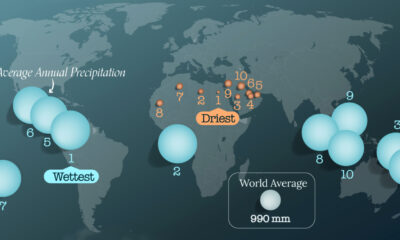
Mapped: The World’s Wettest and Driest Countries